Microsoft has launched a new performance monitoring application called Microsoft Performance HUD (Head Up Display). Normally if one wants to monitor the system performance in Windows 10, he will use the Windows 10 Performance Monitor.
Microsoft Performance HUD is different from the Performance Monitor in the sense that it will only monitor one specific process in real-time. It will detect and report information like module load/unload history, thread create/destroy history, Registry activity, file I/O activity, soft and hard application hangs etc. in real-time.
According to Microsoft:
HUD (“Head Up Display”) is a performance profiler that monitors the following data in real time or via Event Trace Log (*.etl) analysis, showing associated call stacks for create/destroy/read/write operations as appropriate. HUD displays the following information in real-time: module load/unload history, thread create/destroy history, registry activity, file I/O activity, hangs (soft and hard), GDI/User handle activity, GDI leak detection, heap allocation activity, insights that call out perf issues automatically detected by HUD.
Microsoft
It’s like a semi-portable app which installs but does not have any customization options. Just run the HUD executable after installation, attach it to a process and start monitoring the application activity.
The default installation location of HUD is:
"C:\Program Files\Performance HUD\hud.exe"
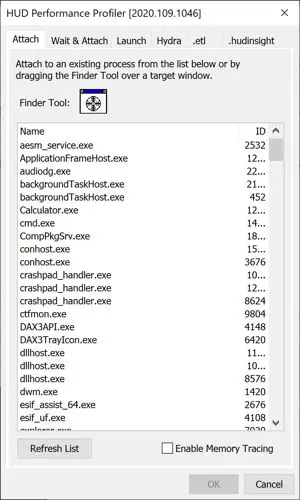
When you run it for the first time, you will see a window like this:

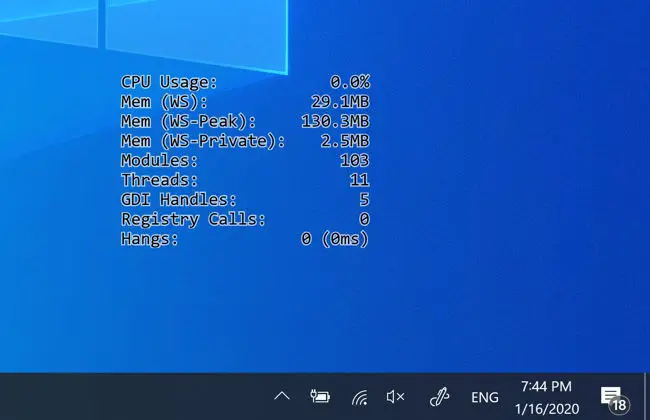
You can double-click any process from the list or use the Finder Tool icon to identify and start monitoring a process or application. After selection, you will see a transparent real-time information monitoring list on your Desktop.

This real-time information will give you an idea of how your application is performing over time and when and why it’s hanging.
You can also run HUD from the command-line. By default, I would run it like this:
"C:\Program Files\Performance HUD\hud.exe"
To know more about the command-line switches, you can run the following command:
"C:\Program Files\Performance HUD\hud.exe" /?
Microsoft Performance HUD is really useful for your critical application to check and see if the apps are running without any issues. For what purpose you would use this app?


2 comments
Robert Baker
Click the perf indicator window to see a more detailed view of the perf data.
Usman Khurshid
Great tip Robert. I didn’t know it existed :-)