Using System with Windows OS or any other, it’s obvious that you might occur any problem with any program. Any freezing or slowdown of system, the program may crash or not giving its 100% as u want from that program or too much memory is using or anything like that. For all these problems, the Resource Monitor is present to help you out. In this article, we will go through the how Windows Resource Monitor helps us and its alternatives.
Windows Resource Monitor
Open the Run dialog and write “resmon” and the Windows Resource Monitor window will open.

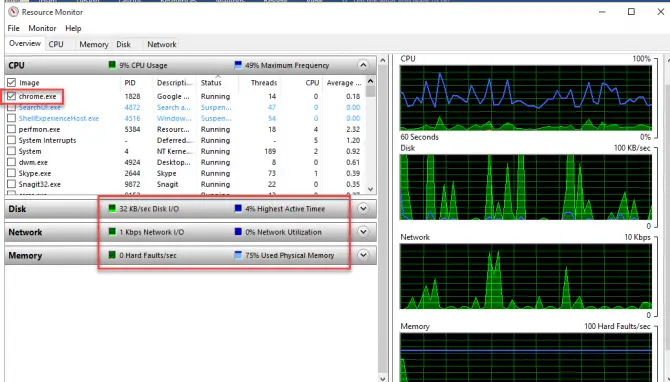
Then there will be graph for different options like CPU, Memory, Disk, Network.
These will provide you information about each application of your system, how much it taking CPU performance and memory and size on disk and all things. So according to this monitoring, you can control your System’s performance and close the applications if they are taking large amount of memory and speed.
To view the detail for any single process just check its check box and the other panels will show only the resource usage of that particular process.
As I have selected “chrome.exe” so the resource usage of it will clearly show in each window.
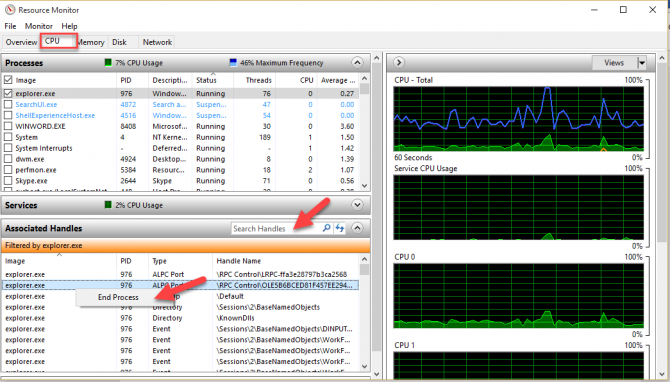
Let’s explore each tab. First one is “CPU”. It gives you the closer look a CPU usage.
You can write anything in “Search Handles” to know about any process in locked folder. Or you can also end any process from here.
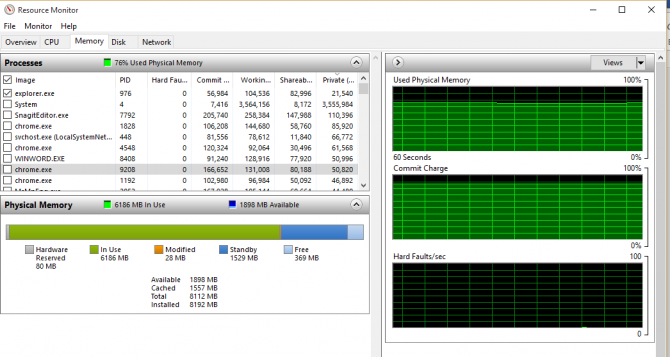
Next, the “Memory” tab. It shows all the memory used by applications. If you are having 0 memory free that’s a good thing. Because your CPU is consuming all memory for its applications as a good resource. If applications are using al memory that means they are loading fast and quickly.
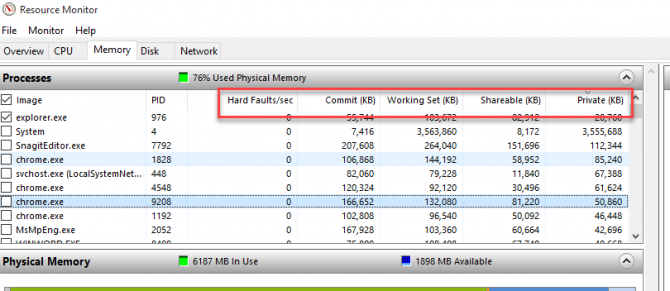
The thing which you must know is memory usage for a single application.
Hard faults: This means that your application try to open into any specific page but can’t. so, having too many hard faults is not so good for your memory.
Commit: This is amount of space required by App for paging file
Working set: This is the total or actual amount of space used by the App
Shareable: This amount of space can be shared with other processes.
Private: This is memory which is private and only be used by this particular App.
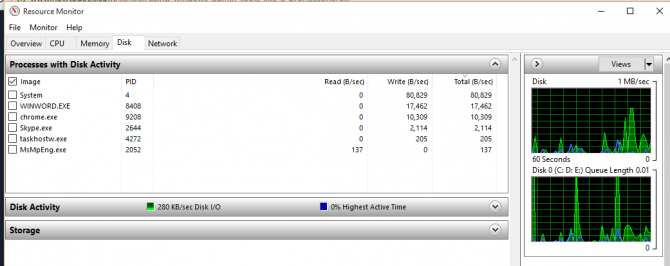
Next the “Disk” tab, which tells you how much the App is Reading and Writing in bits/sec.
And the last one is “Network” tab. This will show you the TCP connections and the listening of processes on Port.
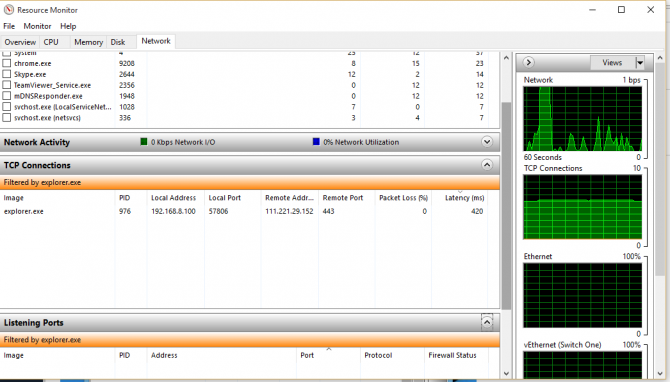
Recourse Monitor is helping a lot in monitoring for reach of the process which is running into your system with every perspective. You can easily identify and configure about each process.
But not every user like the Recourse Monitor. They want the Third-Party tool for monitoring of their System’s processes. Here is the best alternatives of Recourse Manager. From them you can take the same services as Recourse Monitor is providing.
Windows Resource Monitor Alternatives
Rainmeter
Rainmeter is tool for Windows and it is freeware.
This is very small and light on disk tool. When you install it small mini tools of Rainmeter will appear on your desktop that are monitoring your System’s performance throughout. You can add new features and skins to Rainmeter and make it look like according to what you want.it is available in Portable version also.
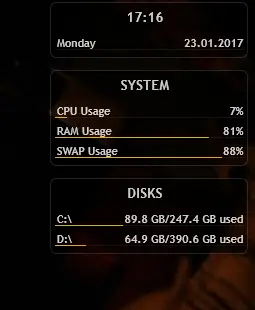
Just like Windows Recourse Monitor, it provides you monitoring for CPU, Disk, and Memory for each process and for overall System. The benefit of Rainmeter is that it displays all the monitoring information right on the Desktop. So the user doesn’t need to open anything in order to see the system stats.
SysTrayMeter
This is also a very small tool and available in your Taskbar when you install it.
Download SysTrayMeter from here
It only shows you the CPU and RAM monitoring. It doesn’t provide you any option for customization or all that. Very simple and light tool that may help you to find the System’s and RAM’s performance
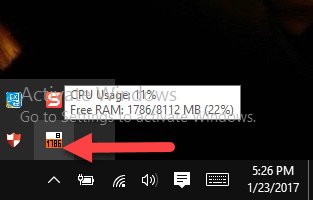
Like Windows Recourse Monitor, it will display the CPU usage and available RAM.
If you are using too much RAM, the RAM icon’s I this tool will change that represent the increased amount of Ram usage.
Taskbar Meters
Taskbar Meters is not a single App, it consists of 3 Apps that provides you the ability to monitor the resources of your System.
Download Taskbar Meters from here
One is Task-bar CPU meter. That monitors the CPU performance of your System just like WRM (Windows Recourse Monitor).
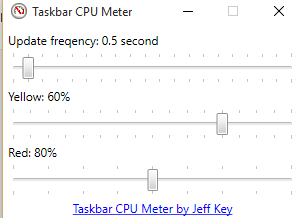
Other is Taskbar Disk IO Meter which checks the Disk input output of System as checked by WRM.
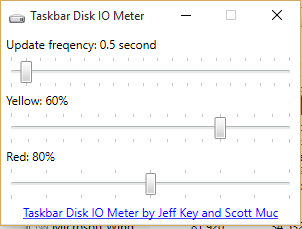
And the third one is Taskbar Memory Meter.
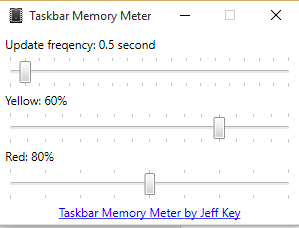
Three of these Apps will settle down in Taskbar of System. And if anything, abnormal happen, these will change their colors so that user can take action accordingly.
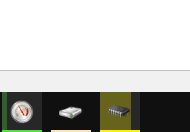
This can provide you help in monitoring your CPU, Memory and Disk as like WRM but it doesn’t provide detailed view for each process. That’s little bit disappointing for users.
Wise System Monitor
This is also freeware tool and helps you to monitor your System’s resources.
Download Wise System Monitor from here
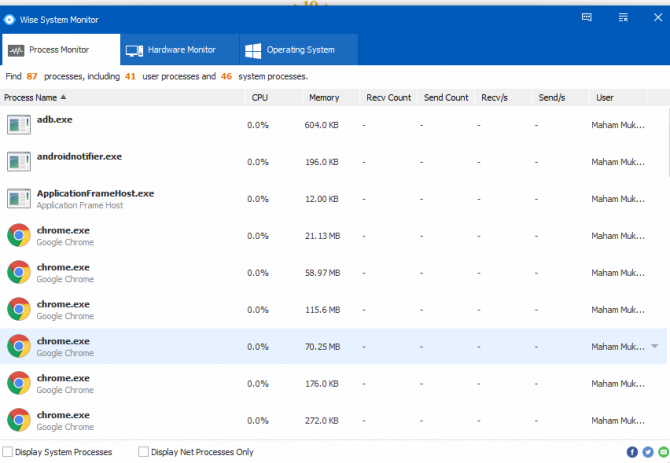
It will give the detailed window after installing. All current running processes will be shown in the list. And the usage of CPU and available RAM for each process will also display in this tool.
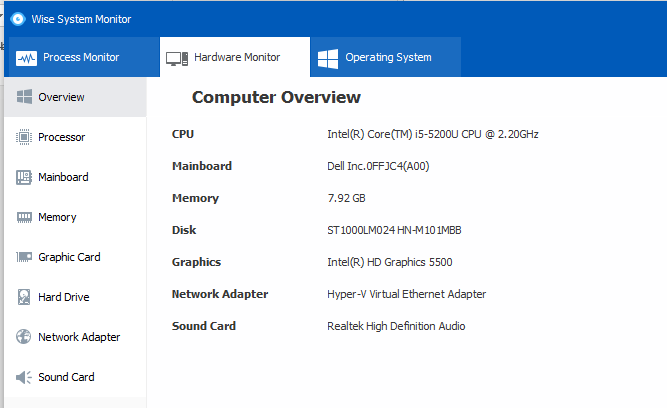
The “Hardware Monitor” tab will provide you all the information about your hardware of system that is motherboard, RAM, graphics and all that.
The Recourse Monitoring tool will remain open in bottom right corner of your System and show you the uploading and downloading rate. And the overall usability of CPU and RAM of your System as like WRM.

This is very useful and applicable tool for users. Its interface is also very simple and user capturing.
These all are the tools for Recourse Monitoring of your System. You can go for any alternate of WRM if you don’t like its too many feature or want something simpler. Otherwise you can use WRM as it is built in. but its alternatives are also providing you the same features and facilities as WRM is providing.

